OEE (overall equipment effectiveness) tells you how much of a machine's planned time turned into good product. It is three percentages multiplied together: availability, performance and quality. A machine that ran every planned minute, at full speed, and made nothing but good parts would score 100%.
OEE = availability × performance × quality
The three factors
| Factor | The question | How to work it out |
|---|---|---|
| Availability | Did it run when it was planned to? | Run time ÷ planned production time |
| Performance | Did it run at its rated speed? | (Ideal cycle time × total count) ÷ run time |
| Quality | Was it right first time? | Good count ÷ total count |
A worked example
A filling machine is planned to run for a 480-minute shift, less a 30-minute break: 450 minutes of planned production time. Its ideal cycle time is 1.5 seconds a bottle.
- Availability. It stopped for 50 minutes: a jam and a slow changeover. Run time is 450 − 50 = 400 minutes. Availability = 400 ÷ 450 = 88.9%.
- Performance. In those 400 minutes (24,000 seconds) it filled 12,800 bottles. At full speed it would take 12,800 × 1.5 = 19,200 seconds. Performance = 19,200 ÷ 24,000 = 80.0%.
- Quality. 384 of the bottles were rejected or reworked, leaving 12,416 good ones. Quality = 12,416 ÷ 12,800 = 97.0%.
- Multiply. 0.889 × 0.800 × 0.970 = 69%.
That is the example on the Lean Day Toolkit OEE poster: 89% × 80% × 97% is 69%. Three numbers that each look fine on their own multiply into a machine that delivers about two thirds of what its planned time could.
How to read the number
Look at the weakest factor first. In the example, performance at 80% is the problem, not the stops. The machine runs, but slowly: worn parts, short micro-stops nobody logs, or an operator running it below speed to avoid jams. The poster's point is that slow cycles hide better than stoppages, because nobody walks over when a machine is merely slow.
Only right-first-time counts as good. A bottle that was reworked still took machine time to make twice. Count it as a loss in quality, even if it shipped in the end.
About "world class". A figure of 85% is widely quoted as world-class OEE (roughly 90% availability, 95% performance and 99.9% quality). Treat it as a reference point, not a target to hit on day one. Many plants that measure honestly for the first time find a number well below it, which is the useful part: it shows how much capacity the machines you already own could give back.
Common mistakes
- Using a "realistic" speed instead of the ideal one. If the ideal cycle time is set to what the machine usually manages, performance looks like 100% and the loss disappears.
- Leaving short stops out. A two-minute jam every half hour is half an hour lost every shift. Log them, or they turn up as poor performance with no explanation.
- Comparing different machines by OEE alone. OEE is best for tracking one machine or line over time, not for ranking a new filler against a 20-year-old one.
A free OEE poster
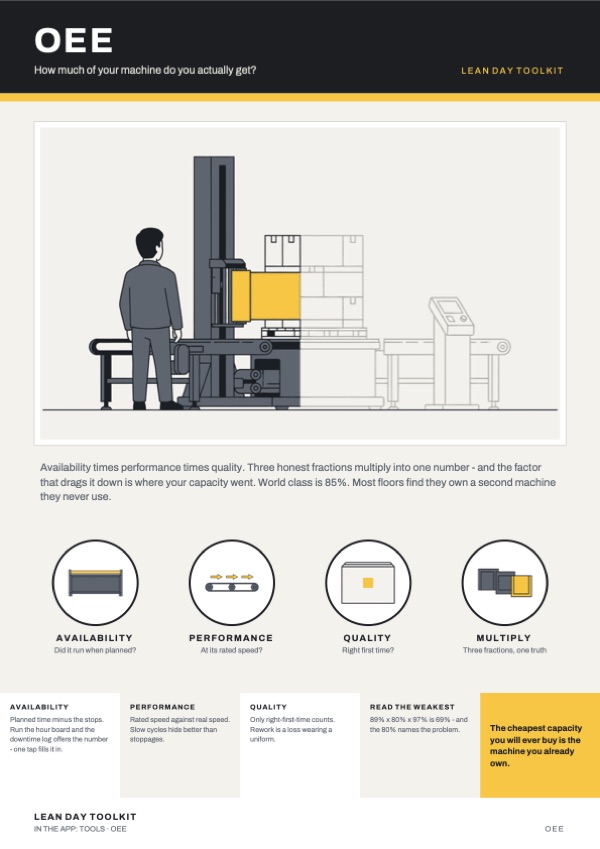
The OEE poster puts the three factors and this example on one A4 page for the board. It is free to download, print and use in your own workplace, and one of 19 free lean posters; the Downtime poster goes with it.
OEE in Lean Day Toolkit
Lean Day Toolkit has an OEE calculator under Tools → OEE, and it is one of the tools that stays free. If you run the hour-by-hour board and the downtime log, the calculator offers the availability figure from them in one tap.