A 5S audit scores an area against a short checklist, one question at a time, from 0 (fail) to 4 (held without anyone pushing). You walk the area, score what you actually see, and add the scores up into a percentage for each of the five S's and one for the whole area. Then every low score becomes an action. Done weekly, the scores show whether the area is getting better or slipping back.
The five S's
| S | Japanese | What you check |
|---|---|---|
| Sort | seiri | Only what is needed is in the area |
| Set in order | seiton | Everything has a marked place and is in it |
| Shine | seisō | The area and equipment are clean, and cleaning finds problems |
| Standardize | seiketsu | The first three are written down and done the same way by everyone |
| Sustain | shitsuke | It is still happening next week, without a push |
What each score looks like
These are the definitions on the Lean Day Toolkit 5S Audit poster, with an example for one question: "Are walkways clear and marked?"
| Score | Definition | On the floor |
|---|---|---|
| 0 | Fail. Not done, not safe, or nowhere to be found. | No walkway lines; pallets standing in the route. |
| 1 | Poor. Attempted once, then abandoned. | Lines were painted, but they're worn away and nobody keeps the route clear. |
| 2 | Patchy. Works when someone pushes it. | Clear on audit day; blocked again by Thursday. |
| 3 | Good. Standard met and mostly held. | Clear and marked, with the odd item left for a few minutes. |
| 4 | World class. Held without anyone pushing. | Clear every time anyone looks; people move things off the route without being asked. |
Score what you see today, not what the area is usually like or what was promised. If you can't find it, it scores 0.
A worked example
Say an area is audited with a 20-question checklist, four questions for each S. Each question can score up to 4, so each S is out of 16 and the whole audit is out of 80.
| S | Scores | Total | Percentage |
|---|---|---|---|
| Sort | 3, 3, 2, 4 | 12 / 16 | 75% |
| Set in order | 2, 1, 2, 3 | 8 / 16 | 50% |
| Shine | 3, 3, 4, 3 | 13 / 16 | 81% |
| Standardize | 2, 2, 1, 2 | 7 / 16 | 44% |
| Sustain | 1, 2, 2, 1 | 6 / 16 | 38% |
| Whole area | 46 / 80 | 58% |
Each percentage is the total divided by the most it could be: 12 ÷ 16 = 75%, and 46 ÷ 80 = 57.5%, rounded to 58%. The shape is typical of an area that has just had a big clear-out: Sort and Shine are good, but nothing holds it there yet, so Standardize and Sustain are low.
Four answers scored 1 (one in Set in order, one in Standardize, two in Sustain). Those four become actions. Nothing scored 0, which would have been the urgent kind.
Tips for a fair audit
- Stand in the area, not at a desk. Score what is in front of you.
- Photograph it. The picture is the evidence, for the score and for next week's comparison.
- Keep it short and regular. The poster's line is
Twenty questions. Twenty minutes. Every week.
A short audit done every week tells you more than a long one done once a quarter. - Rotate the auditor. Fresh eyes catch what the area's own team has stopped seeing.
- Don't chase the number. A team that is judged on the score will learn to tidy for audit day. A team that sees its low scores fixed will start raising them itself.
A free 5S audit poster for the board
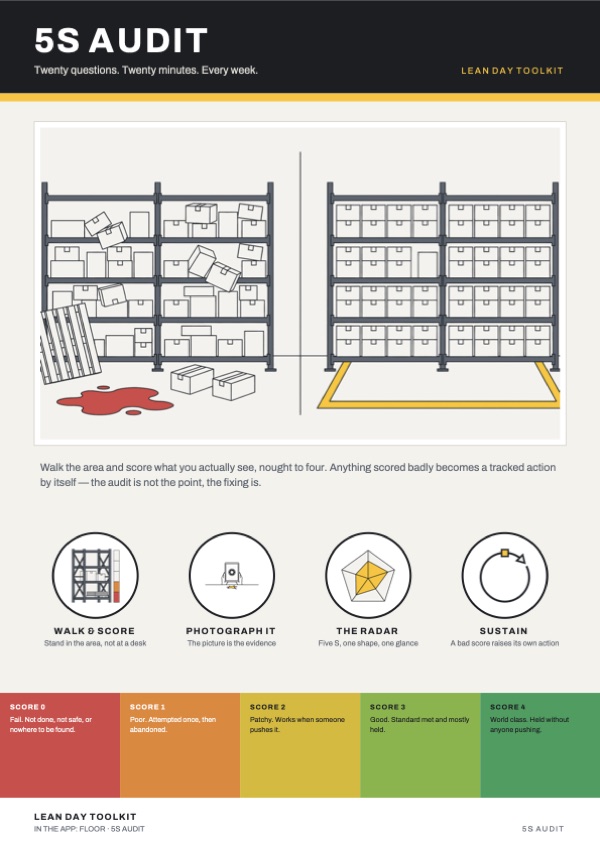
The 5S Audit poster has the five score definitions above on one A4 page, so everyone scores the same way. It is free to download, print and use in your own workplace. It is one of 19 free lean posters, alongside the Visual Standards poster, which helps with Standardize.
5S audits in Lean Day Toolkit
Lean Day Toolkit runs 5S audits under Floor → 5S audit, and audits and their PDF report stay free. Each question is scored 0 to 4, with a photo and a note if you want them. The app works out the percentage for each S and for the area, and draws them as a radar, one shape you can read at a glance. Any question scored 0 or 1 raises its own action, and a 0 is marked high priority. If the same question fails again in the same area before the action is done, the app adds it to the open action instead of filing a second one, and raises that action's priority if the new score is worse.